Ruapehu Skifields Insolvency

So I wanted to give a quick update on the insolvency situation with the skifields on Mount Ruapehu. You might have noticed today in the press that the valuation seems to be settling in for what the life pass holders’ votes would be worth at the watershed meeting in terms of voting on the outcome of the insolvency process.

Community Ownership

I’ve had a few people ask me, “Okay, well look, how did we get into this situation in the first place and what do we want to have happen going forwards? Because it’s just all too complicated, too much corporate stuff.”

The first thing to remember in terms of fundamental principles is the skifields have run as a community owned non-profit for 70 years. Thousands of skiers over the years have bought debentures, bought shares in the company, bought life passes, season passes, etc. All sorts of people have been involved over time and fundamentally, this is a skifield that was created by the skiers for the skiers.

And therefore, in a lot of ways, the skiers are the natural owners of the skifields on Mount Ruapehu because we are the ones who will support the skifields in good times and in bad. And owning a ski field in a national park on a mountain that is sacred to the local Iwi, it can’t be about exclusive possession, and profit, and extracting value. It’s about a responsibility to cherish and respect and stay humble in the face of the mountain.

People keep saying to me that, “Oh, we don’t want to end up here again” and you know, the fastest way to end up here again is to give the ski fields to a hundred percent for-profit corporate investor and then wait for a couple of years for a snow bad snow year, or some trouble getting local staff or an eruption. And then the business-case for top-up investment won’t stack up in, we’re gonna be right back here with the company out of money quicker than a rich banker can say. “I’m sorry, the business case doesn’t stack up to throw good money after bad, and we’re pulling the plug.” And that’s something that it was just too terrifying to imagine in terms of the consequences for the local economy, the local community, and the skifields.

So if you want to avoid being back here, then we need to let the people who love the mountain have the chance to become the long-term owners of the assets. And a little bit like parents of teenagers, we might not love it if the skifields happen to run out of money again. And they call up asking for money in the future, but then we are always gonna be there. We will do whatever it takes to keep these skifields operating because we love being up in the mountains and we value it. And, and that’s, something that’s fundamentally priceless. And it’s not gonna appear on the balance sheet for some corporate investor.

It’s not a non-profit because we hate making money, it’s because it’s a tough mountain and frankly, you need to be ploughing every cent that is generated in terms of returns back into maintenance and improving the assets. It’s an expensive sport, and the non-profit element does help keep the lift prices modest and and inclusive in terms of people being able to come out and try out the sport. It means that when you come to negotiate with DOC or with Iwi about the concession renewals, there’s not just some rich overseas company exploiting our natural resources for their own gain. It’s a locals mountain, and these days, by locals, I mean the entire central North island.

Insolvency background

So, where did things go wrong? I think when things went wrong with the skifields, was when they tried to get more corporate and started borrowing money, covid and some of the recent bad snow years were really just the last straw. They’re not necessarily what caused the situation that we’re in at the moment. The Sky Waka is a national treasure and it was funded by a pretty good mix of bonds from Iwi, strategic investors, government loans, etc. Lots of people came together to get that project going but there should probably have been shares or multi-year passes or life passes or something sold so that it wasn’t just all debt. Because we know, particularly now, that no business can survive only on borrowed money.

The former board of directors had somehow formed this view that you either couldn’t sell shares because there was no dividend, or that if you did sell shares that would somehow be illegal, or that even if you could legally sell shares, that no one would want them. And we’ve now tested that out pretty thoroughly, and that’s not quite right. We’ve gotten independent legal advice on issuing shares. We’ve even went as far as writing to the FMA and, obviously they can’t provide legal advice, but we’ve found plenty of examples of co-operative businesses raising capital, and we’ve found lots of examples of companies that don’t pay a dividend – but rely on a capital gain or capital appreciation, and they’re perfectly able to raise capital. So this business is able to be invested in. It might need some modifications to do so, but it is an investible proposition and we’ve done research that has shown that there are tens of millions of dollars out there in people that want to invest in supporting the skifields.

There are thousands of people who have come out saying that if we could get this thing onto Snowball Effect or the Unlisted Market, some sort of ability for people to buy shares, that they want to be co-owners of the skifields. That’s something that’s exciting to people. And if there was a return that happened to go along with it, then more the better, but that’s not the fundamental thing driving them. And that’s okay.

We’ve run some financial models going back the last 15 years just to test how the share price would have fluctuated if you priced it based on “net asset value”. And so it ranges between about $800 per share when the company’s having a bad time, and then it went up to about $1,700 per share and the average is about $1,000 a share. Now, that’s no indication of what the share price would be going forward, but what it did prove is that it is possible to run a model that shows what a fair price would be for the business in terms of either buying shares, selling shares, operating a market, all of those sorts of things. It’s not, it’s not to say it’s easy, but it’s certainly possible.

Voluntary Administration Process

So it is good that the government have stepped in and supported the skifields over the last year or so. It’s been amazing to have that support, but seeing them then turn around and use those loans to step in, override the legal Voluntary Administration process and basically run a “shadow liquidation” and sell off the assets and privatise them. Just doesn’t seem fair-play. The government are major creditors and they’ve put significant money into the business and as the crown, they could have been uniquely positioned to try and bring all of the parties together and find a collaborative solution that created long-term stability for the skifields that we’re all looking for. But somehow it seems like the government have appointed the specialist insolvency practice, and they’ve been conducting basically a shadow liquidation and they’re selling off the assets to the highest bidder. This process needs to have been run with the highest levels of integrity because it’s such an important asset to the community.

One thing I can point to is that PwC have published on their website, the official minutes of the creditors committee meetings, they’re worth reading because one of the things that they show is that the government have not attended any of those meetings. And I mean, where have they been? They’re every week and they’re talking about the skifields and the government just haven’t been there. And, that’s telling. I think what’s happening, if you read the minutes of those meetings, that you can tell of layered in between the conversations, that the government have taken control of the process. So they’ve been the ones that wanted to sign off on the season passes, which still haven’t gone on sale, – the snow’s falling and we still don’t have season passes available for sale. And they’ve been wanting to be the ones reviewing potential bidders and organising the pre-pack process in terms of how the insolvency plays out.

It’s amazing that the government stepped up. But they only, invited us as a ski community to get involved at the last minute. So we ended up spending our Easter Weekends writing up a bid, and we did that because no one else had officially put up their hands and said that they working a bid. There were some rumours about who might put in a proposal, but they’d been pretty secretive about that. And, I respect that because they had NDAs, but it did mean that we were left with a situation where the fact was that no one had put up their hands. And so someone had to, and so we as a community did put up our hands to be involved. And the government put a bunch of terms on that bid. Conditions that I can definitely not talk about because they’re subject to very specific non-disclosure agreements. But they had pre-existing views on everything from life pass holders, whether or not they had to pay, treatment of secured creditors, trade creditors, even the process and mechanism for implementing of the transaction. And again, I cannot talk about that, but what I can say is, it’s not a pretty picture.

I think what’s gotten the local community, Iwi, and the Mountain Clubs riled up is that the government then seemed to have gone out and chosen their winners without consulting anyone. And probably, not giving us a fair go. There’s been no transparency on what the criteria are for those selected bidders. And even then, it’s not the government’s mountain to just unilaterally sell to the highest bidder. That doesn’t seem fair. There have been two community bids and it looks like the corporate types aren’t giving them a run or following due process. But, that’s a story for another day.

National Park Concession

I will let you in on a secret in terms of why I think community ownership is so important to the ski fields. So the National Park operating concession renewals come around every 30 years. And so the ones that are in play now will eventually be renewed. And when they are, DOC are going to have to go out to the local Iwi and the local community to get consultation on that process. And by then it might be person-hood for the mountain, or co-governance, all sorts of things could have shifted.

I’ll tell you one thing. It’ll be the kids now in Raetihi, Taumarunui, and Tokaanu going to school in their childhood right now. They will grow up with however we set up the ski fields now. They will grow up with that being their experience of skiing on the mountain. So if the ski fields are community-owned, welcoming, lots of local employment, really good social connections, really well connected to the local community, good terrain parks, good vibes. Then when the concession renewals come around in 30 years time, it’s gonna be a big, big tick. We love being up on the mountains. We love going skiing. Sounds good. Keep it up.

But if we fumble it right now and we sell off the ski fields to the highest bidder, it gets privatised, sold into corporate hands. They double the price of lift passes and turn. The whole thing into a playground for the ultra-rich with valet parking, champagne bars, sit down Alpine Restaurant Dining experiences. Then when the concession renewal comes around, the local community will buck. They’re gonna kick back and they may kick back hard and we could lose the right to ski on the mountain entirely. So fundamentally, this looks like it’s an argument about corporate business models, but actually it’s about being respectful guests on the mountain.

Capital Planning

So, where’s the money gonna come from? There are thousands of skiers who have pledged tens of millions of dollars. People love skiing on Mount Ruapehu and they’re willing to pay for ski passes in advance. Willing to invest big and small amounts, volunteering to help out. There’s a Give a Little, which has raised about $25,000 from about 800 people, last time I looked.

Peter Hillary has come on board as a founding patron of the community effort, he’s been absolutely amazing as a patron because he really believes in the importance of the ski fields in getting New Zealand as outdoors and introducing people to the natural alpine environment. He’s taking a much wider view of tourism in the central North Island. In the regional economy, thinking about employment in places like Raetihi, Taumaranui, Turangi, or Ohakune, these aren’t necessarily affluent communities, and there’s a real need for year round employment in the tourism industry.

There’s been an amazing groundswell of support. There’s about $10 to $15 million in investment required over the next five years, and it’s not all in year one, which is some of the stats that we’ve seen or the kind of scare tactics saying, “Oh god, you’d need $10 million on day one”, and it’s just not true. There is maintenance that needs to be done on those mountains, but it can happen in a staged manner over time, and that’s part of what we need in terms of a sensible plan going forward.

There’s about $13 million in expressed interest in terms of equity investment that would be combined with about $7 million in a settlement fee, which is life pass holders paying to retain the right to ski. – Probably at about $1,000 per pass, although that’s subject to some discussion. There’s good years and bad years, but there’s some operating cashflow, which helps support the business. There’s probably about $7 million in what we call one-off product purchases, so that’s things like five-year passes, platinum parking passes, new life passes, or life pass renewals. That’s actually a non-trivial amount of money that could come from the ski community in terms of additional product purchases. And then eventually, if you need it there, there’s probably about $10 million that you could make available in strategic long-term debt. You don’t want this business living hand to mouth and just borrowing money to survive, but with the right strategically aligned investors and bondholders, there is absolutely a model there in terms of making investments into new assets.

Fundamentally, the Ruapehu ski field situation is about a back to basics, locals and families. Who love the mountain and are basically up against the rich bankers and bureaucrats who want to turn the ski fields into a plaything for rich overseas tourists. It’s about privatisation versus community ownership.

I have a four year old and a two year old, and last year we took them to Happy Valley. And then went up the gondola for a fluffy and look, they’re going to remember that weekend for the rest of their lives. They still talk about how much fun it was being up on the mountain and the idea of losing that for an entire generation of New Zealanders, because not everyone can afford to fly to Queenstown for a weekend in the school holidays. That’s what’s been driving me.

Despite, frankly, all sorts of corporate politics, we’ve had death threats for some of the team, angry locals, online social media trolls, people threatening me and my family, people leaving bad reviews on my employer’s website, all sorts of crazy stuff. But it’s worth it because it’s the humility and the camaraderie of being up in the mountains that’s kept the ski fields in community ownership for two generations. We can’t fumble the pass. Let’s not just flog off the assets to the highest bidder and leave our kids with just another corporate model. That doesn’t seem right.

It’s a tough mountain. And they say if you can ski at Ruapehu, you can ski anywhere. But anyone who spent time in the mountains knows that you have to look out for each other. This is a once in a generation opportunity to set up the ski fields for another hundred years and to hand it over to our children in a way that they can respect, love, and engage with the mountain that we all love.

Product Design Videos

Modern product design is a mix of user interface design, user experience, graphic design, design thinking, research and data visualisation. There are a few videos that have influenced my thinking over the years on what great design looks like the the way that we can create products and services that meet people’s needs in surprising and delightful ways.

Practical design processes

Steve is one of the co-creators of the Tailwind CSS framework and his talk at Laracon 2019 was intended for software developers but is actually a good view into how a modern interaction designed solves practical problems.

Design sprints

The Google Ventures design sprint methodology is a bit extreme (they try and fit everything into one week), but the Sprint approach is a great combination of Design Thinking methods with the Lean Startup mindset.

CSS for rapid prototyping

Adam Wathan is the main creator of Tailwind and his talk is developer focused, but it’s a good insight into the mindset behind how Tailwind can be used for rapid prototyping.

Human centred design principles

Dan Norman’s book The Design of Everyday Things was hugely influential on how I think about human centred design.

Data Visualisation

Data visualisation is vital to making finance and investing understandable to people. In 2007 Hans Rosling presented one of the best TED talks of all time when he used charts and data visualisation to help people understand global health policy.

Design Thinking

The original gangsters IDEO at the height of their awesomeness (they never quite adapted to digital design) but this video changed my life back in 1999 when the ideas of rapid prototyping, user observation and designing for latent needs were counter-cultural and revolutionary.

Digital Transformation for SMEs

I spend most of my time at the coal face of new product development inside tech startups. But I’m occasionally called on to help with the broader application of technology throughout a medium-sized or larger organisation. I love seeing how improving their digital tools and systems can make an entire organisation more customer focussed.

Some digital projects only impact one part of the overall customer experience, but these days, any good software project should really consider the wider context of the entire organisation and the whole customer experience that they deliver.

Different company sizes approach digital transformation differently

I’ve noticed that digital transformation projects can be very different in a small to medium sized organisation. Corporates, startups and mid-sized SMEs handle digital transformation and customer experience innovation very differently:

  1. In a corporate there are whole teams dedicated to technology and the connections between functional departments. While there is a lot of bureaucracy, digital transformation and customer experience projects are feasible inside a corporate because they can throw resources at a problem.
  2. In a small business or startup, the whole team is closely enough connected that cross-functional collaboration is inevitable. While resource constrained, the ability to implement change quickly makes startups fast to adapt to changing circumstances and customer needs. They also often have the advantage of dedicated internal software developers, digital marketers and operations specialists with deep technical systems experience.
  3. Good honest medium-sized SME businesses can be the teenagers of adopting digital technology. Big enough to have departments with competing goals and seperate tech systems. But small enough to be resourced starved and unable to invest in major organisational change projects. Digital transformation is hard for SMEs.

Icehouse Ventures is a small, independent rogue team that spun out separately from the Icehouse several years ago. I’m now the CTO of that business and we effectively operate as a tech startup ourselves with dedicated marketing, operations and software development capability. But it wasn’t always like that. And the wider Icehouse (in particular the SME learning & development business) has been through a genuine company-wide digital transformation over the last two to five years. There are several lessons that we’ve learned at the Icehouse in pursuing our own digital transformation and in helping other medium-sized New Zealand businesses with adopting digital technologies better across their whole business.

Digital technology maturity scale

Digital transformation is simply a description of the broad adoption of digital technologies throughout a business. Digital transformation is best measured by how connected together a customer’s experience is with the business. There are several levels of maturity in a company’s gradual digital transformation:

  1. Disconnected Experiences: At level one, every business system is separate and siloed (or possibly offline entirely). For example, it’s annoying for customers when a store’s e-commerce website can’t show whether a particular branch has stock on a particular product because the stock management system doesn’t talk to the website CMS. Or when you lose your receipt for a warranty claim and the loyalty card system won’t talk to the warranty claim software.
  2. Connected Experiences: At level two, a company’s various internal systems are separate but are starting to be connected by syncing tools and APIs. This starts to allow for more connected experiences. For example, an e-commerce order can be re-routed easily to in-store click & collect. Or a forgotten loyalty card can be easily looked up using a phone number.
  3. Seamless Experiences: At level three, a company’s systems are so well integrated that they can be navigated by the customer just as easily as internal staff. At this level we see self-service customer portals, hybrid in-store and on-line checkouts, and in-store payments collected by a self-service mobile app.

Customer Experience Canvas

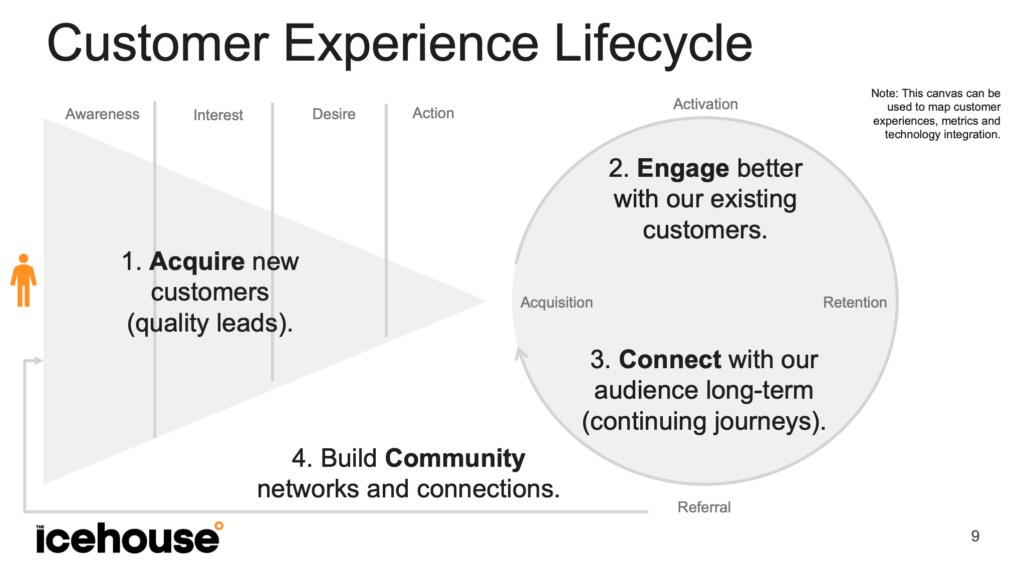
The tool I used to map and diagnose digital customer experiences throughout the full customer lifecycle is the Customer Experience Canvas. The CX Canvas combines a pretty standard marketing funnel (based on the AIDA model of awareness, interest, desire and action) with a CX Flywheel (similar to the one proposed by HubSpot with stages for acquisition, activation, retention and referral).

There are several potential layers to the canvas depending on the project and intended application:

  1. Experience: The surface layer of the funnel and circle can be used to map the digital touchpoints a customer interacts with throughout their experience of your product. Making these experiences more connected and efficient is a key part of digital transformation.
  2. Data: The same canvas can be used at a deeper level to map out the data used to measure and track the experiences. The metrics we use across the whole lifecycle are based on Dave Mclure’s ‘pirate metrics’ (so called because the acronym is AARRR): Acquisition, Activation, Revenue, Retention and Referral.
  3. Technology: Even deeper, the canvas can be used to map the technology stack and systems integration work required to deliver a seamlessly connected customer experience. This layer looks at the syncing tools, triggers & events and APIs needed to make the whole system work together.

Agile Project Prioritisation Matrix

In 2001, as a reaction to traditional engineering project management techniques (that had been optimised for construction projects), a group of software developers proposed the ‘agile manifesto’. This approach to software development prioritises speed, simplicity and efficiency. There are lots of tools and techniques from agile that can be applied to an organisation wide push for digital transformation.

I’ve found that most companies undertaking digital transformation end up with a giant todo list and no practical ways to have shared conversations about prioritisation. One of the best tools to reach agreement on prioritisation is the Agile Prioritisation Matrix.

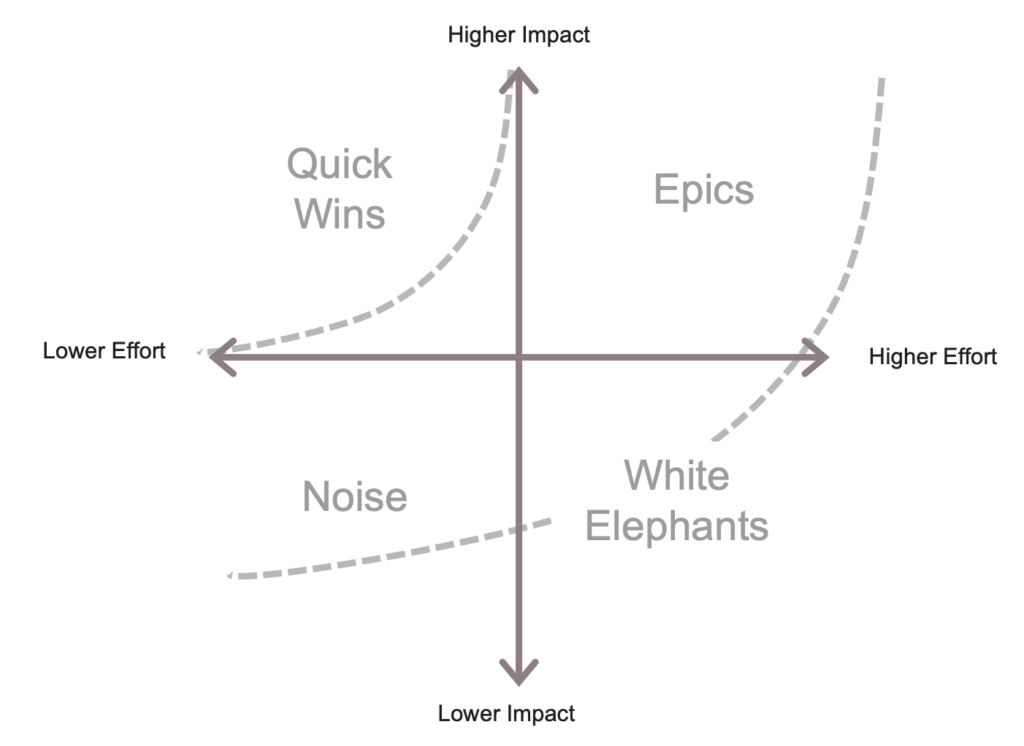
When considering a whole of company digital transformation it can be an overwhelming task and it’s hard to know where to start. The agile project prioritisation matrix breaks projects down by:

  1. Impact: Potential return on investment, improvement in customer experience, etc
  2. Effort: Likely expense, time and complexity of implementation.

Projects that are high impact and low effort are quick wins and should be done first to build momentum. High impact and high effort projects are called ‘epics’ and are important to tackle but take time to finish. Whether easy or hard, lower impact projects should be avoided where possible.

Digital Transformation Checklist

Having mapped the customer experience and prioritised the key projects, it’s also worth checking that you have all your basic tools in order so nothing gets lost. Boiling all the strategy down, I’d still suggest checking these basics are in place:

  1. Marketing: Website Analytics & Email Newsletter metrics.
  2. Sales: Customer Relationship Management System.
  3. Production: Invoicing, production and shipping software.
  4. Service: Customer Feedback System such as NPS surveys.
  5. Operations: File storage, knowledge management and internal instant messaging.

Across all of these, it’s essential that your CRM can act as more than just a sales tool and provides enough APIs and/or syncing tools to eventually act as a centralised customer data platform. Because in the end, having your customer data centralised in one place is the most important part of providing a seamless digital customer experience.

You can learn more about digital transformation in a podcast I did with Bryar Stewart from the Icehouse team:

Top Laracon Conference Presentations

Laracon is an ongoing series of conferences and events about the Laravel software development framework. We use Laravel pretty heavily at Icehouse Ventures because it powers our Investor Portal. I’ve learned a lot over the years from the various Laracon conference recordings. The topics range from basic coding best-practises to advanced systems architecture, database design, all the way through to user interface design. The talks I get the most out of switch between broad theoretical best practises but then back it up with practical live coding examples. I’ve made a list with a few of my favs and some notes on how they influenced view of what’s possible with Laravel…

SOLID Design Principles

This talk with Katerina Trajcevska covers the basics of the SOLID coding principles. SOLID is short for:

  1. Single responsibility principle,
  2. Open-closed principle,
  3. Liskov substitution principle,
  4. Interface segregation principle, and
  5. Dependency inversion principle.

The SOLID jargon can seem heavy at first, but it actually fits nicely into good Laravel coding practises and Katerina lays things out simply and clearly.

Curing the Common Loop

This talk probably changed my approach to coding more than any other talk. The idea of using chained functions, scopes and collections aren’t that revolutionary by themselves, but seeing Adam collapse whole pages of complex nested code into a single line is just magical. The elegance, power and simplicity of Laravel collections when they’re used properly blew my mind.

CRUDDY by design

Another mind-bending talk from Adam Wathan. CRUD is short for:

  1. Create
  2. Read
  3. Update
  4. Delete

I do not necessarily agree with everything this talk, but the mental exercise of trying to see everything in a modern web application as a CRUD operation is a matrix shifting moment of clarity. We now heavily use Laravel’s built in “Resource Pattern” to link models, views and controllers into common CRUD functions.

Eloquent Performance Patterns

Eloquent is the data modelling ORM (Object Relational Mapping) tool built into Laravel. It’s an amazing tool, but Jonathan comes from a ‘bare metal’ background and like me, learned MySQL years before he learned to code in a modern framework. As such, he thinks in raw database queries. Laravel’s ‘Query Builder’ is the database layer that gets things from the database before passing them to Eloquent (to wrap the richness around). This talk is all about speeding up Eloquent by doing more in the database.

Laravel Performance Optimisation

Kasia Zien takes a pretty detailed and hard-core approach to performance optimisation, but it’s eye opening to see her logic for how to squeeze the best performance out of Laravel.

Software Design Patterns in Laravel

“Design Patterns” are best-practises or standard approaches to common problems in programming. Not every design pattern is a good habit (the repository pattern can over-complicate a project fast). But when used carefully, the various software design patterns make for better and more consistent code. We use the Presenter Pattern at Icehouse Ventures to tidy up data before sending it to our Vue JS front-end.

The Laravel Way

Jeffrey Way is one of the original gangsters in the Laravel community. As an OG, he’s been working with Laravel so long that he’s drawn out the broader mindset of what I think of as the “Laravel Way”.

Chasing Perfect Code

Yet another Adam Wathan talk, but honestly every one is a level-up in terms of how I write code. Adam goes through ‘code smells’ and things to tidy up. Things like nested-conditionals may technically work in a solo project or a university code exam, but in the real world our code needs to be read by other developers or by your future self. This presentation taught me to make my future self’s life easier with code that is simple, readable and clear.

Diving Deeper

One of the things I love most about Laracon is being exposed to more advanced topics in software engineering that I might not have otherwise discovered. For example:

  1. Database Indexing – The art of indexing a database is kind of obscure, but the pursuit of fast queries and ‘groking’ database indexing stretched my mind and reminded me how much I love MySQL.
  2. Denormalisation with Eloquent – The Icehouse Ventures investor portal calculates pretty advanced ‘professional investor grade’ maths and charts like IRR, TV/PI and other venture capital finance metrics. Many of those are too complex to run on the fly so we tried caching them. But with thousands of investors and hundreds of metrics our cache became a mess. Database normalisation saved us but also forced me to learn about cache warming and cache invalidation. This is the Laracon talk I wish I has watched before we built our Entity Stats table by hand.
  3. Resisting Complexity – When I dive into the Laravel core code (the stuff we’re not really supposed to see and can’t edit) I’m always surprised by how small each function is. Each function does one thing, then passes it onto the next atomic unit. At first it seems wasteful, but Adam walks us through how breaking big functions into small ones makes them cleaner, clearer, more re-usable and more testable.
  4. Clean Code – Uncle Bob invented the SOLID principals and is a legend in software development. Not Laravel specific, but a great reminder of the wider context of why clean code matters.
  5. Design Patterns that pay off – Matt Stauffer lays out some advanced design patterns and boils them down into simple good habits for good code.

I’ve saved all these Laracon presentations as a YouTube playlist so it’s easy to find them, play them and refer back to them in the future: Laracon YouTube Playlist

Using JavaScript with Laravel through Inertia and Livewire

For the upcoming Icehouse Ventures investor portal we chose to build the application using Laravel, which is a php framework. Frameworks like Laravel speed up the development process by providing a lot of the scaffolding that you need for a modern web app.

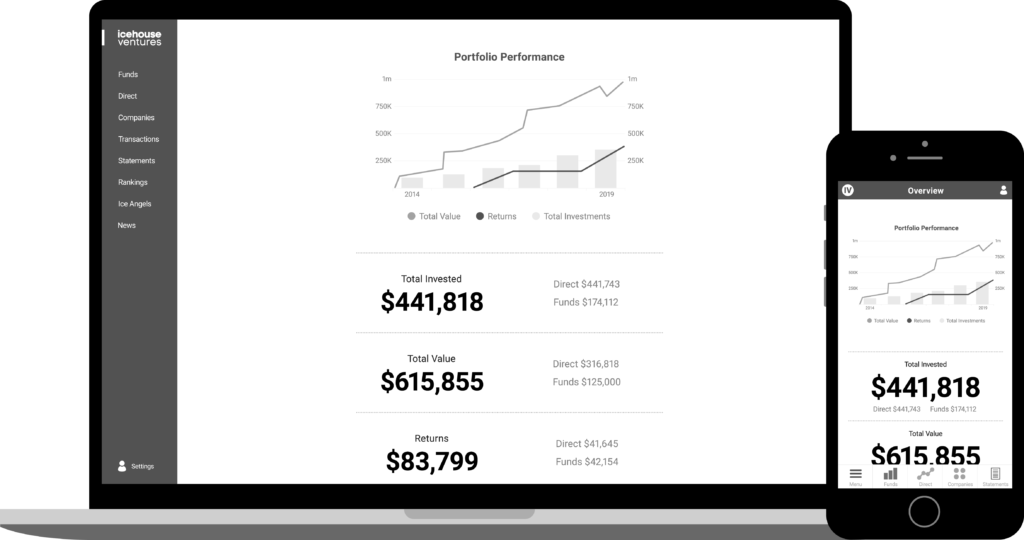
Mockup of the upcoming Icehouse Ventures Investor Portal.

We started off looking at using off-the-shelf tools such as venture capital fund management software and various online angel network platforms. But we couldn’t find any tools that would allow us to provide combined reports that showed a consolidated view of both direct angel investments into a company and indirect fund investments into the same company through a fund the investor was a part of. Investors told us that this was a mission-critical feature so they could evaluate their effective exposure to particular startup companies in their portfolio.

We also evaluated a range of other low-code and no-code solutions such as Salesforce and various template-based databases and website builders. These were ok, but couldn’t handle the depth of complexity investors wanted such as calculating IRR over long time periods, exporting PDF statements and ranking portfolio performance against other investors.

Laravel uses the classic Model-View-Controller architecture.

In the end, we chose php and in particular Laravel because of the robust stability of a MySQL database and the power of the Model-View-Controller approach to the code structure. MVC is a common pattern used in enterprise architecture to build scalable and stable software systems, the key elements are:

  • Model – A data model that manages your database and represents data as objects that can have relationships with other objects. For example, we have a model for Users and a model for Companies in the investor portal.
  • Controller – Traffic controllers that manage how data moves around your application. Controllers fetch data from the Models and send it to the Views. In Laravel, the controllers do a lot of heavy lifting in the background such as security, permissions, sorting and filtering.
  • View – Templates that render html and CSS for the end-user to see what you want to show them. Laravel uses a php and html template format with no JavaScript interactivity by default.

Adding JavaScript to Laravel

As much as I love php, we wanted to provide investors with a modern app-like experience. To do this we needed a modern JavaScript framework such as React (from Facebook), Angular (from Google) or Vue (an open-source JS framework). I chose Vue because it’s popular in the Laravel community, not owned by a giant tech company and is the fastest to learn for a non JS developer like me.

There are several approaches to getting front-end JavaScript frameworks to work with back-end applications like Laravel:

ApproachAdvantagesDisadvantages
Single Page Application with API – The traditional approach has been to build the JS front-end as a single page application and feed the data through to the app using a private API.By keeping things separate, it’s easy to focus on one thing at a time. Back-end developers can work on the back-end code and front-end developers can focus on the front-end code.My experience with SPAs was that I wasted a lot of time keeping the API and the front-end talking to each other. Frustrating points included login tokens and data-table filtering. In a small in-house tech team there’s no such thing as separate back-end and front-end teams, we’re all full-stack by necessity.
Livewire – This approach allows you to use little bits of JavaScript inside your normal php templates.It’s cool to have php everywhere and JavaScript only where you most need it. Like a modern framework approach to JQuery.The disadvantage of Livewire is that it’s still mainly using php not JavaScript, so it doesn’t have the app-like feel of an SPA. It’s also not full-on best-practice JavaScript using Vue or React so you miss out on the Vue and React templates and resources.
Inertia – This is a new way to use JavaScript inside the MVC framework of a php app. The Model and Controller are in php and the View is in JavaScript.Best of both worlds. Inertia lets php do what it does best (databases, models, relationships, security, etc) and JavaScript can do what it does best (render the front-end interface and provide interactivity).Not technically an SPA. Requires some finesse to make it feel fully app-like and the progress loader is a bit clunky. Inertia puts JS right inside your php monolith so you now have a multi-language code base that might feel weird to some developers.
Livewire is a new method for using JavaScript inside a php template.

Laravel 8 was released recently and now includes both Livewire and Inertia as options for the default Laravel user interface templates (called Jetstream). This is exciting because it will expose these two new approaches to more developers. But it’s been confusing for a few developers who are used to thinking of JavaScript as a different world from php.

Inertia allowed us to use Vue JS in our Laravel app.

On balance, we opted to use Inertia for the Investor Portal because it kept our code base all in one place and allowed us to move fast and change things quickly based on user feedback. I’ve already had dozens of moments where we wanted to make a change to the way that something is displayed in the portal. It’s a true joy to be able to make a quick change to the Company model, flow it through the Direct Investments controller and have it pop up in the investor portal Vue file all in the same code-base, with easy Laravel debugging and easy feature-testing and front-end testing. By having Vue running inside Laravel I’ve upskilled quickly on JavaScript without having to go all-in on complex JS routing and data manipulation.

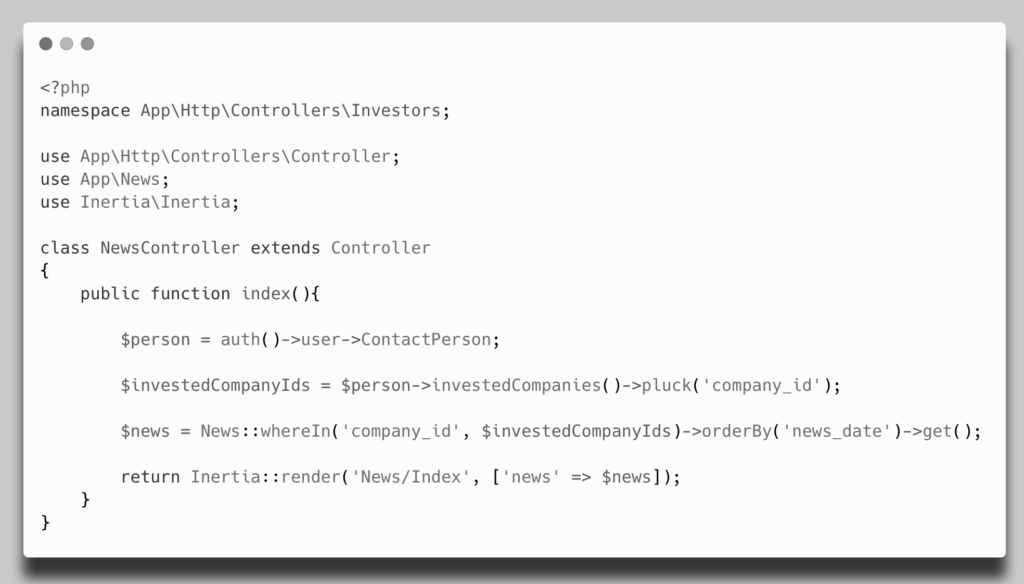
Notice the simple call to Inertia from the Controller. Just like a Blade template.

We also went for Tailwind CSS instead of the more established Bootstrap CSS framework. Tailwind is a utility framework approach which means that instead of single giant templates in CSS with little HTML tags you just layer lots of little HTML tags onto an element to make it look the way that you want. It seems messy at first but once you get used to it, it’s life changingly fast. Using Tailwind, Alipne JS, Livewire and Laravel is called the TALL stack and I’m calling Vue, Inertia, Tailwind and Laravel the VITL stack. (Some people prefer the name LIT for this stack but I think Vue is a vital part of what makes this approach so awesome).

Building software in-house is an unusual move for a Venture Capital fund but Icehouse Ventures has a unique approach that combines the scale of the Ice Angels network and the depth of major funds like IVX and Tuhua. Globally, the venture capital industry is being quickly re-shaped by increased investor demands for transparency & reporting and by startup founder demands for faster decision making & streamlined capital raising processes. Technology can be a force multiplier for us and having both php and a modern JavaScript framework like Vue in our toolkit means that we can move faster while still keeping things safe, stable and secure.

Advanced Video Conferencing for Remote Work

Now that everyone is settling into remote working, we are finding that being productive requires more than just having the basics of team chat and video conferencing in place. To generate real economic output in uncertain times you need to be communicating closely with your customers, suppliers and business partners. Experience suggests that there are actually three levels of remote working:

  1. Internal communication and basic connectivity. 
  2. Client communication including meetings, events and training. 
  3. Productive deep-work including multi-party workshops and brainstorming sessions. 

Understanding the type of interaction you want to create will help guide the setup for your meetings and the tools that you use.

Internal: Your IT team will probably already have set you up with some sort of video calling platform. You should check that this video calling tool also includes team chat, calendar integration and external calling as well as internal. This means that you’ll probably want to be on a professional corporate communications platform such as Google Hangouts, Microsoft Teams or Slack. These chat plus video calling tools are great for reducing email and smoothing out daily internal communication. Hot tip: Create a lot of ad-hoc chats with small internal groups around key projects, these are where th actual work gets done (not in the big all-company threads). 

Client calls: For small group and one-to-one client calls, I advocate using whatever tool your customer is already used to using. If they use Skype, Zoom or MS Teams then find a way to use whatever they are using because it’ll be familiar and allow them to focus on the content of the conversation. If your client doesn’t have a preferred tool, then you can default to using whatever internal tool you already use because you’ll be comfortable with the tool and can share your experiences with your client giving them a chance to try it out. Hot Tip: Get yourself set up in advance with logins for all the most common video calling tools so you’re ready to go with whatever your clients use. 

Large group calls: Video calls with a large group tend to stretch the internal communications tools a bit too far because these tools are usually designed for small internal team meetings. For example, Microsoft Teams only shows four people on screen at any one time. Zoom is becoming the market leader for large group calls and it’s worth getting to know the advanced features of Zoom before you need to host a large call. These types of large group calls are a passable substitute for networking events, professional presentations and team training. Hot Tip: Have a two-person hosting team with one person focused on managing the humans (moderating Q&A etc) and one person managing the tech (such as muting and unmuting people). 

Presentations: For one-way presentations to a large audience, there is a whole range of dedicated webinar tools such as Crowdcast, Webinar Jam and Go-to-Webinar. At the Icehouse, we’ve been using the dedicated webinar tool inside Zoom for our Coronavirus Business Support Webinars. The key to good webinar presentations is a lot of practice (especially with guest speakers) and putting a lot of effort into encouraging audience interaction. Hot Tip: Nominate a ‘studio audience’ of three to five people to have their cameras turned on as an audience panel so the whole thing looks more interactive and the presenter has someone other than themselves to look to for feedback. 

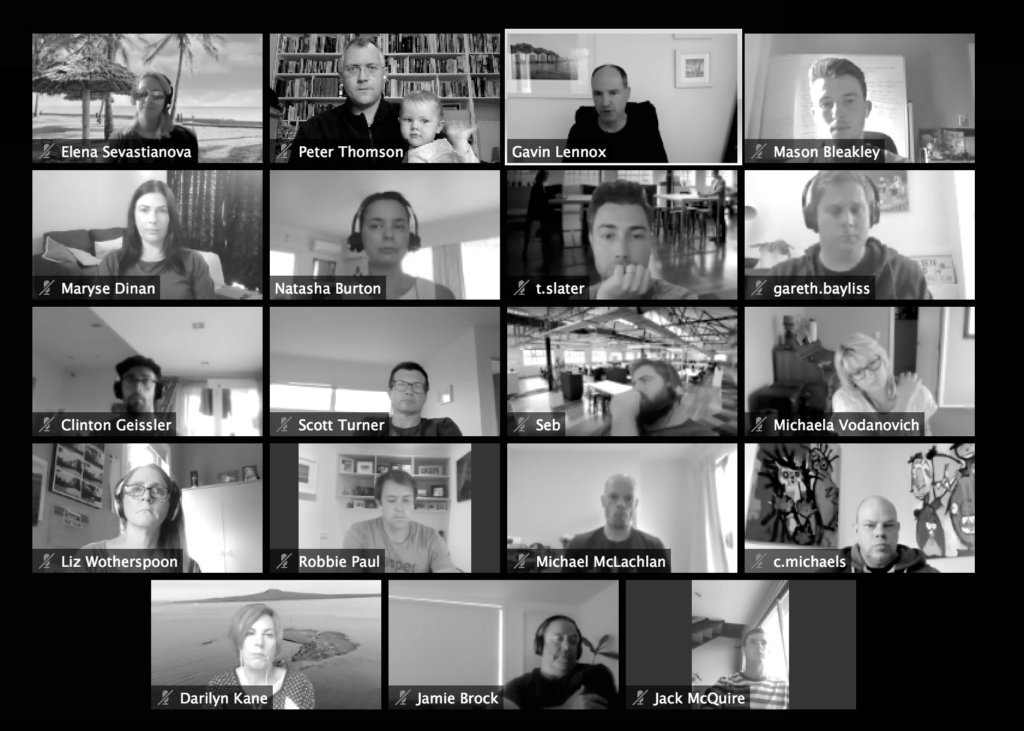
Zoom Meeting (Notice that everyone is shown in an equal grid.)

Tips for webinars and large meetings

Large format meetings are a great way for people to feel connected when we’re all working remotely and uncertain about the economic outlook. It’s great to hear about other people’s experiences and see how much we all have in common no matter what industry we’re working in. At the Icehouse, our team ran webinars and large format Zoom meetings with over a thousand people in the first week of lockdown and we had to rapidly arrange dozens of private Zoom calls to pivot our coaching and advisory activities. We’ve learned a few hard lessons along the way. Here are a few quick tips that apply whatever type of call you’re running: 

  • Encourage everyone to turn their video on: Most people hate being on camera but having the video on for all participants is vital for making things interactive. Seeing everyone gives the presenter non-verbal feedback so they can see if what they are saying is landing. It also allows the participants to see each other which makes the whole thing more personal. It can also be useful for quick hand signals such as thumbs up and waving to attract attention. 
  • Look your best: The key to decent video is to have the camera at eye level (or above) so put your laptop on a cardboard box or prop your phone up somewhere. It’s also important to have good lighting. Try to have any natural light coming from in front of you rather than behind you. Sitting in front of a window will cast you as a silhouette. 
  • Clear audio: Wear headphones. Even if your computer has a decent microphone and speakers, experience suggests that laptop speakers are more likely to cause an echo and the default laptop microphone is more likely to pick up random background noise from around the house. Even a cheap iPhone headset is miles better than the laptop mic. Personally I use bluetooth airpods because I can easily switch them between my laptop and phone. 
  • Use chat: Most video calling tools also have a group chat feature. Use this for general banter, sharing links and random comments on the topic at hand.  The chat is a key part of making webinars and large format meetings seem interactive. People will only use the chat if the hosts and panellists start first so model the behaviour you want to see.
  • Facilitator: Having a strong facilitator on a video call is priceless. There’s always someone who goes on too long or doesn’t know when to let other people speak. A good facilitator can guide the conversation and keep everyone on track. 
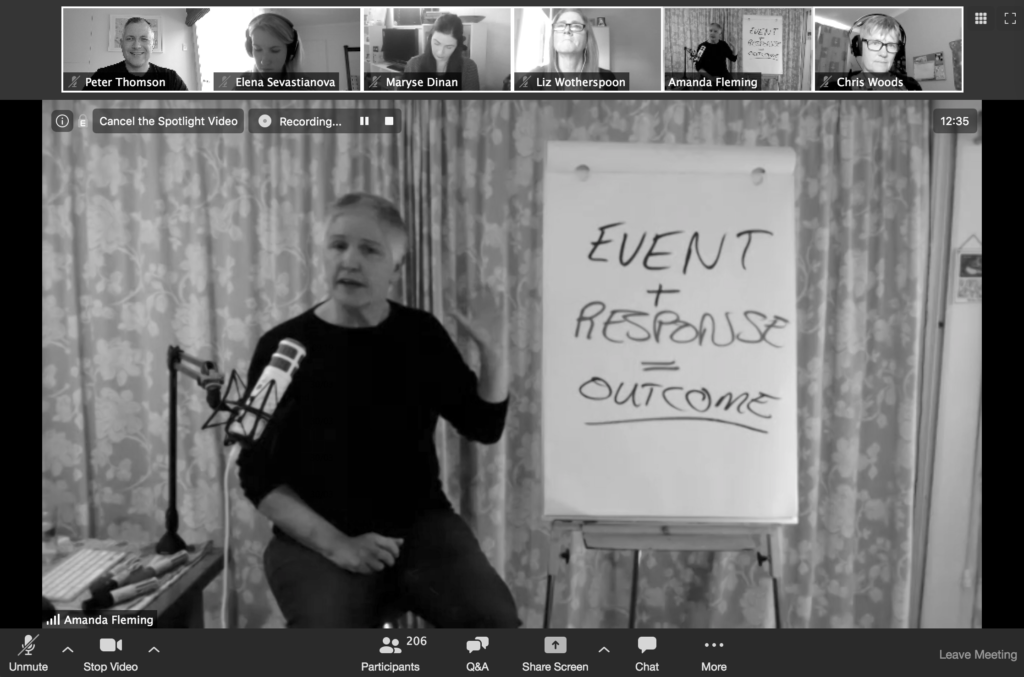
Zoom Webinar (Notice that the presenter is spotlighted and the panelists are shown in a strip at the top.)

Advanced Zoom Tools

We’ve been using the Zoom software extensively at the Icehouse and there are a few tips that are specific to the Zoom platform:

  • Gallery View: Zoom has a button at the top right that toggles between Speaker View (seeing only the person that is speaking at the time) and Gallery View (seeing a grid of videos from all the attendees). The host can toggle between these to set them for attendees. But attendees can override the setting for themselves. Our experience is that Gallery View is more friendly and engaging because you can see everyone at once. 
  • Screenshare: Sharing a slide show is a great way to keep a presentation on track and keep the pace up but in the Zoom software the screenshare takes over the whole screen and hides everyone except the person that is speaking. There’s an advanced ‘side-by-side’ mode that allows you to see the Gallery View during a screenshare but no one ever finds that so we recommend keeping the presentations as short as possible and spending more time on Q&A.
  • Security: As Zoom has become more popular there have been a lot of press articles about privacy and security concerns about the software. Some of these sound alarming at first but most of them are just hype. My favourite example was a widely reported vulnerability that in practise required an ex-NSA hacker to have physical access to the device to exploit. If the NSA is breaking into your house to hack your laptop, then you probably have larger problems than Zoom. 
  • Privacy: There has been a rise in Zoom Bombing which is the practise of randomly logging into other people’s calls uninvited and causing trouble. The cure for this is to be careful about where you share the links to your calls and to require registration in advance for large public calls. 
  • Moderator: Having a tech person or at least an experienced power-user on each call alongside the facilitator means that one person can manage the conversation going on front-stage and the other person can manage things like chat, people waiting to join, banning any trouble makers and providing support for anyone who can’t get onto the call. 
The Zoom Host Dashboard

My final tip is to over-share the links to your calls. Send the link when people first rsvp, then send a calendar invite, then send a reminder one hour before the call. Keep these reminders super short so they don’t annoy anyone.

We will be publishing best practise guides for remote working, video calls and webinars on the Icehouse website shortly along with an updated guide to the best Zoom privacy and security settings. You can follow along with all our Covid-19 support and resources here Icehouse 2020 Covid Support for NZ Small Businesses

Agile Branding

Agile branding is the art of quickly creating and improving your brand positioning so you can iterate and improve your marketing. When you’re starting out on a new venture you may feel the need to map out every step of your go to market strategy in advance. Normal project planning would tell you that a detailed roadmap is a great way to execute a large project. But when it comes to branding and marketing, you are in a constant dance with your customer. And we all know that dancing can be chaotic. There is real value in taking a more iterative and agile approach to building your brand.

The book Lean Startup by Eric Ries is a great reminder of just how powerful the tools of lean thinking, agility and adaptability can be in growing a business. The iterative thinking from the world of product development can also be applied to marketing.

A truly agile brand is user-focused and iterative. Building an agile brand is not about the rituals of agile software development such as sprints, scrums, stand-ups, and retrospectives. Instead, it’s about adopting the customer cantered thinking of the agile mindset into every part of your marketing.

To create an agile brand you will likely still need an agile workflow and processes, but that’s not what will make your brand agile. Brand agility comes from a fundamentally agile and iterative approach.

In a large organisation where you’re looking to bring formal agile methods into the company to speed up the learning cycle for your day-to-day marketing, then the process may be more formalised. But the agile mindset of delivering customer value, testing things quickly and learning from your mistakes will be the same for big and small companies.

Branding all at once

To create an agile brand you are going to move forward on all fronts at once. Parallel processing is an unusual way for a company to create a new brand, but it’s remarkably similar to the way that an individual designer works when they are actually doing the job of designing a new brand. 

I look at a brand as three main elements, the strategy & intent, the copywriting messagingand the visual system design. You can be prototyping, improving and iterating all three of these brand elements at once. To create a new brand quickly you need to address the strategy, messaging and design together.

1. Agile brand strategy

Creating and iterating a strategy is all about creating just enough strategic clarity to be able to make decisions and move forward day by day. Most strategies have so many different elements and so many different components that people spend as much time creating the strategy as they do implementing it. By the time traditional companies have implemented anything, they have to go back and create a new strategy.

There is a saying in the sport of boxing that “Everyone has a game plan until they get punched in the face.” Your brand strategy needs to be able to adapt quickly in the face of adverse feedback. To be resilient, an agile brand strategy needs to answer three questions:

  1. Who do you want to serve?
  2. What pain do you solve for your audience?
  3. How do you do it better than your competitors and substitutes?

An agile approach to brand strategy means that the answer to these three questions may change on a week to week basis as you collect customer feedback and monitor the performance of your trial marketing campaigns.

2. Agile brand messaging

Having an agile tagline that is constantly being updated would seem like a weird thing to do, but the way that you describe your brand should be evolving as you learn from your ongoing customer discovery and market research. Therefore, you need to be able to change the way that you describe your business over time. You don’t want to lock too many things in too rigidly into your brand.

The link between strategy and copywriting is the stories that you tell. If you find yourself, on a repeated basis, re-telling particular anecdotes about your brand, then those are a good place to look for copywriting and key messages.

A story is the functional unit of meaning; it is a way of conveying meaning to an audience. You should aim to standardise and modularise your copywriting so that you and the rest of your team can take key elements and recombine them to create collateral and correspondence on the fly.

The next important thing to realise about agile copywriting is the importance of testing:

  • With traditional ad agency copywriting you would rely entirely on market research, intuition and instinct to create pieces of communication that would persuade your audience.
  • With agile approaches to copywriting you can test the effectiveness of different pieces of copy and improve it as you go. This approach draws as much from the direct marketing and direct response school of advertising as it does from ad agency copywriting.

3. Agile brand design

The visual design system can seem like the least agile part of a brand. However, in the age of digital communication, with the right tools you can constantly be improving and iterating your brand’s visual design.

Your visual appearance as a brand can be just as lean, agile and adaptable as any other part of your strategy.

  • The problem is usually that companies are too reluctant to invest in good quality design as a priority and to continue investing in design over time.
  • The other half of the problem is that the providers of design services have been far too willing to sell their wares as one-off batch-and-queue projects instead of fighting for retainers to act as brand stewards.

Designing a new corporate logo has become something that is so mystified and sacrosanct that it is impossible to imagine quick, small, agile improvements to a company’s logo over time. But if you step back and look at Shell’s logo over the years or Pepsi or Coke (or any great brand taken from a far enough viewpoint), they have all iterated and improved their logos significantly over the years.

The challenge for a startup is simply to accelerate this process and to be willing to make changes faster to improve the brand. The unspoken restraint here is that startups are unwilling to invest in good visual design. It makes perfect sense for a startup to hire a developer and to be continually improving their product, yet somehow it seems self-indulgent for them to hire a graphic designer and to be continually improving their brand. This is because most startups misunderstand what design really is.

Good design doesn’t just make a product look good; good design makes a product work better for the user. Good design is user-centred design and that type of design is always going to be lean and agile, practical and grounded.

Clarity of strategy, message and design

Clarity is the key to agile branding. The way to create a brand that can survive rapid iteration is to increase the amount of clarity across strategy, messaging and design.

  • A clear strategy will be repeatable and articulable to all of your team members. It will help guide all aspects of your decision making in marketing, product and customer experience.
  • A clear set of messages to describe your brand and to persuade your audience will be more likely to be useful to the rest of your team and therefore more likely to be actively used.
  • Clear visual identity, through colours, fonts and shapes, increases the chances that your brand will be applied by the team members in a consistent and high-quality way.

An agile brand has a clear strategy, a clear message, and a clear look and feel.

Data Driven​ Marketing

Data Driven: Harnessing Data and AI to Reinvent Customer Engagement by Tom Chavez, Chris O’Hara and Vivek Vaidya is one of those rare books that you can tell has been written by real-world practitioners (not consultants or theorists). It’s the best book that I’ve read so far on marketing technology and customer experience.

The three authors have all been deeply immersed in projects using big-data to personalise and optimise marketing at scale:

  • Tom Chavez was a co-founder of marketing technology platform Krux before it sold to Salesforce. He’s now a co-founder of startup studio Super{Set}.
  • Chris O’Hara was responsible for marketing at Krux and now leads marketing for Salesforce Marketing Cloud.
  • Vivek Vaidya was a co-founder and the CTO at Krux and is now a co-founder of Super{Set}.

The book was published in 2018 and is the first time I’ve seen someone really tell the truth about the nitty-gritty of delivering data-driven marketing at scale. The authors focus on the practical ways that data flows through a modern business.

The case studies aren’t just abstract examples, but real projects that Tom, Chris and Vivek have worked on with clients.

Personally, I’ve lived through the complexities of integrating CRM systems with web analytics, customer loyalty data and all sorts of other complex data sets. The real value in bringing these things all together isn’t just in marketing, it’s transformative for the whole business.

The book is so good that I thought the best way to review it was to pull out some samples that summarise the key concepts in the author’s own words (I’ve lightly edited the samples to fit the blog format). To really get the value of the content you need to read the examples and context so I recommend you grab the hardcover, kindle or audiobook.


Principles of customer data

There are three foundational principles described in the book: 

  1. Embrace the always changing “human becoming”. Let go of static concepts like audience segments and inflexible stages of the marketing funnel. Your customers and audiences are leaving behind breadcrumbs that can help you engage with them in an ever-evolving, multifaceted way.
  2. You have more data than you think … and you think you have more data than you actually do. Whether you believe you’re sitting on a mountain of data, or you think you’re hopelessly impoverished, the truth is somewhere in the middle. Build an inventory of your data assets, the data that’s hiding in plain sight as well as the missing (but gatherable) data within reach. 
  3. There is no single truth, just more and less useful theories. The data game isn’t about being right or wrong; it’s about being more right than wrong as you compile a continually evolving theory of the consumer. Make mistakes; learn fast.

How to use data

After unifying your data-in and your data-out in a single platform, apply the five sources of data-driven power: 

  1. Segmentation. Let a thousand flowers bloom as you define and continually re-define your customers and audiences.
  2. Activation. Target and measure the audiences you want to reach across all the available channels and platforms. Know exactly where “your people” are and how to reach them.
  3. Personalization. Build on segmentation and activation to achieve personalization in the broadest sense – cooler content, more relevant commerce, smarter selling and servicing of your customers.  
  4. Optimization. Adjust the velocity, pacing, reach, and frequency of your messages to achieve maximum efficiency in your marketing spend.
  5. Insights. Use the output from your data systems to accumulate richer insights into your customers. Put this data back into your marketing engine to increase precision, effectiveness, and efficiency.

Avoid data pitfalls

The book warns readers to avoid five pitfalls when implementing a data driven strategy: 

  1. Absence of clear goals for data transformation: Technology itself is not a panacea. Leverage it at the right time in concert with the right people, woven into the right process. 
  2. Lack of a formal owner: Empower a leader and a team to get the job done. 
  3. Operating in a silo: Data transformation entails coordination of complexity. Break the silos and pre-empt the tribalism that can stymie the best-laid plans. 
  4. Boiling the ocean: Celebrate small wins to build organizational momentum. Leverage measurable results from early-stage initiatives to fund future steps. 
  5. Failure to anticipate risk: Remain zen-like but relentless when the inevitable glitches occur. Data pipelines will break; naysayers will grumble. Persuade constituents of the career and company benefits to them of getting behind an all-in data strategy. 

Data layers

When establishing a data strategy for your organization, use the three-layer model to chart the who-what-when-where: 

  1. Know: Invest in data management to know your customers in a dynamic, 360-degree, real-time way. Reach them intelligently and with precision across every channel. 
  2. Personalize: Extend your brand and grow revenue by giving each customer more of what they want and less of what they don’t want. Use AI and machine learning to personalize all engagement—advertising, content, commerce, sales, and service. 
  3. Orchestrate: Reach your customers at just the right time and in the right place by mapping the journey they take with your brand. Measure the effectiveness of different touchpoints in varying sequences and combinations. Intentionally craft journeys that lead to the engagement you seek.

The authors also include guidance on applying artificial intelligence to marketing data and finish the book with several forecasts for future trends across customer experience, data and technology.


The book is available in hardcover, Kindle and audiobook. The audiobook is read by LJ Ganser who was a voice actor in Grand Theft Auto and has recorded almost 50 audiobooks. His voice is confident and clear. He really takes you along for the ride with Tom, Chris and Vivek for some of their client meetings in the early days of Krux.

Overall, a highly-recommended book for anyone that wants to understand how data and technology are changing marketing and customer experiences.

Customer Journey Mapping

Customer journey mapping is a powerful business tool that sits at the intersection of user experience design, customer experience management and design thinking. Journey maps are useful because they can help visualise the interconnectedness of modern (often multi-channel) customer experiences. I’ve built a number of customer journey maps in my time as part of the standard design process for products and services, but recently I’ve noticed that the tool is also useful for mapping out the way that a company’s various marketing touchpoints connect together.

Modern marketing is moving from creating one-off ad campaigns and towards creating always-on marketing systems. Customer journey mapping is increasingly being used in digital marketing to design “path-to-purchase” journeys that can be built out using the new range of marketing automation tools such as HubSpot and Salesforce.

Modern customer journeys are non-linear and can bounce around across multiple stages, channels and touchpoints, but the exercise of converting the chaos of reality into a linear model is helpful in creating a mental model that we can use for planning and making improvements that make things better for the customer.

Customer Journey Map template from design firm Adaptive Path.

A customer journey map tells the story of a customer’s experience with your marketing, product or service over a period time. The most common presentation of the journey map is in a large format diagram that puts the customer’s journey into a linear timeline format. This type of diagram simplifies the complexity of a real customer journey so that general insights can be drawn out and improvements made. A good customer journey map covers all of the touchpoints that a customer comes into contact with while they are attempting to achieve their goal and the emotions that they experience during that journey.

A journey map is useful because it provides context and highlights how interconnected your various brand touchpoints are. In my experience, a journey map is helpful in bringing together people from various functional teams including marketing, design and technology teams. These teams can then work together to use the journey map to spot pain points, gaps in the experience and to encourage empathy for the end customer. Remember that the map is just a tool and the ultimate aim of a journey map is to improve the actual customer experience, not just to document it.

Customer Journey Map example from research user experience agency NN/g.

Steps to create a customer journey map

Based on the workshops and projects that I’ve run in-house and with clients (when I worked in consulting), I’ve found that the key steps to create a customer journey map generally include:

  1. Scoping: The first step in defining a customer journey is to determine the audience or customer segment that you want to focus on and what stages of their journey you want to cover. I’ve found that it’s best to focus on a narrow audience and then go wide in terms of covering the experience stages, so that you can capture a holistic view of the entire journey. It can be useful to use customer archetypes, personas or target segments that you are already using in other parts of your marketing as a starting point for your journey mapping.
  2. Research: A good journey map isn’t just made up out of thin air; it’s based on both robust qualitative research and a decent sample size of quantitative research. Even offline experiences can be measured these days, so there’s no excuse for creating a journey map without some honest self-evaluation and research as the first input. Quantitative business data, such as survey results like NPS or CSAT, and web analytics are great inputs to help to construct, prioritise and enhance your customer experience. Qualitative research is great for telling you something that you don’t know, whereas quantitative research is more useful for confirming a hypothesis. The most powerful qualitative data often contains an “uncomfortable truth”. These hard truths are an excellent raw material for a journey map because they can spur the business into action.
  3. Analysis: The next step in creating a meaningful journey map is to consolidate a broad index of touchpoints into a more focused thread summarising the key customer journey steps. The analysis process is an exercise in selecting the most representative journeys and building them into coherent narratives that move realistically from one step to another. I like to build these narratives in a workshop by taking an individual example customer, starting with them before they have engaged with the company and gradually walking through the process in the customer’s shoes by asking “And what happens next?” after each interaction. The goal is to build a connected series of triggers, reactions and emotional states that flow credibly from one into another in a linear sequence.
  4. Insights: The early research and analysis phases of the process can sometimes be very factual and analytical because you’re trying to capture a lot of information and map out the terrain. Once you have the core narrative down, it’s worth taking the time to explicitly dive deeper into the emotional wants, needs and fears that are present for your audience at each stage. Adding a cognitive or ‘thinking & feeling” layer to the journey map is a way of forcing a team to empathise with their audience. A useful way to break down the cognitive layer is by looking at what the audience is doing, thinking and feeling at each stage. A sparkline showing the enjoyment level at each step is a common way to illustrate these insights, but I find that it needs some example quotes from users to bring the insights to life. Another key tool for building empathy is to map out any particular pain points and friction that occurs for customers during their journey.
  5. Architecture: It’s a good discipline to try and collect the various touchpoints into logical stages that group nicely together. At this point in the process, you have the factual, narrative and emotional elements of the journey map in place, so the next step is to consolidate the various elements into a cohesive overview. This stage is about creating a structure and connecting the journey map into the wider context of the overall customer experience. To ensure that you’re building meaningful insights not just narrating a boring list of facts, I like to focus on the behavioural triggers and transitions between each stage.
  6. Presentation: The journey map graphic is not meant to cover every single variation of every customer’s experience. Instead, it should tell a simple story that focuses on the customer’s most important needs. In my experience, journey maps are a powerful tool because people from varied professional backgrounds can all look at them and find something meaningful for themselves while also being exposed to the wider context that creates the overall customer experience. A journey map needs to be bought to life as a visual artefact that travels around the business and can live on as a guide to future improvements. Your map needs to be clearly written, well laid out and well resolved from a design perspective. It might be unhealthy to fetishise the ephemera of the design process, but without a well-designed journey map as a guide to refer back to, the valuable empathy work done to create the map in the first place can be lost in the sands of time. A good journey map needs to be able to stand on its own without external explanation so that it can act as a persistent record.
Example customer journey from Finish designer Salla Koivu.

Layers inside a customer journey map

Now that we’ve established the core content of the journey map we can quickly run over the key layers in the presentation of the map itself. Not all of these layers need to be in every map and the ones you select will be driven by the type of experience that you are mapping. The layers that are commonly run across a customer journey map to describe the customer experience include:

  1. Phases: What broad stages does the journey fit into? These are usually clusters of similar tasks that relate to the same goal.
  2. Tasks: What are the physical actions that the user takes to move from one stage to the next?
  3. Touchpoints: What are the ways that the user interacts with your brand during this phase? These are usually specific interactions or pieces of collateral, communications or content.
  4. Channels: How are the communications or content delivered to the audience?
  5. Expectations: What is the user expecting from this step in the journey?
  6. Emotions: How is the user feeling during this stage? What are they thinking? What are their wants, needs or fears during this part of the process?
  7. Motivations: What job is the user trying to get done? How does this interaction fit into the rest of their life?
  8. Questions: A great way to create empathy for points of uncertainty is to focus on what questions a user has at each stage in the process. What are they unsure about and what do they want to know?
  9. Obstacles: What pain points and blockers could prevent the user from progressing to the next stage? What is adding friction or not working in the way it is expected to?
  10. External influences: What is outside our control that could influence how the user experiences this step and whether or not they move forward?
  11. Data: What data are we collecting at this stage? What data could support or improve the movement to the next step?
  12. Technology: What systems and processes are needed to deliver or improve this step?
  13. Recommendations: What are the problems and opportunities that we have identified to improve this step?
  14. Objectives: What goals, metrics and KPIs do we want to set for ourselves to measure the success of this step in the journey?
Rail Europe diagnotic experience map from Adaptive Path.

Types of customer journey map

Not all customer journey maps are the same. I’ve noticed that a project can quickly get de-railed when people are talking at cross-purposes about what they need from a customer journey map. For example, a software developer may need the journey map as a finished piece of documentation, whereas the marketing team are still just trying to figure out the key stages. To help you separate out the different types of customer journey maps you can look at several attributes of a map that vary depending on the outcomes that you want to achieve:

Lifecycle stage

A journey map can cover several different parts of the customer’s total lifecycle. I’ve worked on journey maps that cover the “path to purchase”, the process of using a product, or the journey of repeat purchase and loyalty. As tempting as it is to try and cover the entire lifecycle in one map, I’ve found that it’s best to stick to one lifestage as the relevant personas, concerns and motivations can be quite different for prospects, customers and repeat customers. There are other more broad tools for mapping out the entire customer lifecycle such as the business model canvas, CX flywheel, and integrated marketing funnel.

Timeframe

The most basic dimension to choose when creating a journey map is whether you are going to describe the:

  1. Historic record of a user journey – this type of map is used for auditing and business process improvement.
  2. Diagnostic snapshot of the current user journey as it stands today – this type is used in a lot of design thinking to build empathy before starting an NPD project, or
  3. Proposed user experience to be create – this is the type used in ongoing agile new product development cycles in a lot of tech startups.

You can map the current state and future state on the same map by highlighting key gaps and improvements. However, I’ve found that a combined diagnostic and prescriptive map can age quickly once works begins on the improvements, so these days I prefer to choose either current state or future state mapping and focus on getting that right.

Audience focus

Once you know when in time your journey is set, you need to know whose journey it is that you’re mapping. I’ve found that the best method for choosing an audience is to generate personas, archetypes or defined segments of your target audience. Most people design their customer journey for the “average” customer, but I’ve found that it’s best to design for you “ideal” customer instead. Imagine a highly engaged user that said yes to everything that you offered them. Playing the “yes game” is a helpful thought experiment to help you to design a comprehensive journey map.

For brands with multiple audiences, you may need to create separate journey maps for each main segment or audience. The level of detail you choose for the journey map depends on how detailed you want the map to be for each persona.

Data and technology

In design projects, the journey map usually focuses entirely on the user, but for marketing automation projects it’s becoming common to include extra layers in the journey map that include the business data and technology needed to deliver a particular experience.

For digital marketing projects, the user, data and technology layers are all equally important. These types of customer journey maps are useful for bringing together cross-functional teams from different parts of a large organisation. The risk is that the journey map can become a perpetually incomplete set of product specifications because the linear format inherently skips some of the complexity needed in technical systems architecture. For example, flow-charts are better than journey maps at dealing with diverging paths and complex trigger events for internal systems.

The back-stage systems, processes and technology can make or break the front-of-house journey that the user experiences. Mapping the back-stage support systems together with the front-end experience can highlight where the handovers between systems are being missed.

Sources of information

One of the most important but hidden attributes of a journey map is the source of the inputs that created the map. Most of the journey maps that I’ve worked on have been for new products created by companies that already knew their audience fairly well. In this situation, it’s tempting to just base the journey map on the personal experiences of the people in the room. However, to be a robust output, a journey map should really have a robust set of inputs such as:

  1. Qualitative market research that involves proper immersion with the audience. The best source of human insights is to talk to other humans. Conversational interviewing for consumer brands is best achieved through the street-intercept style of research taught in design thinking courses or the ride-along immersion research practised by anthropologists. B2B brands can use a more interview style format to get deeper insights. I’m also a fan of the “be your own customer” style of research where the key people are forced to go through their own customer experience (sometimes called mystery shopper research).
  2. Quantitative data and analytics that tells a compelling story about what parts of a journey work well and what parts can be improved. I like to look at completion speed, drop-off rate and satisfaction data for every step in the process if possible. Net promoter score and customer satisfaction scores can also be a useful input data to identify pain points and prioritise improvements.
  3. Workshops, desk research and intuition, shouldn’t be entirely discarded because sometimes the role of a journey map is to act as a provocation or hypothesis that will get tested through experimentation during the rollout. Also, it possible that some people in your team really do know the customer deeply and are able to articulate their insights in ways that accelerates the research process.

Rail Europe simplified customer journey map by Adaptive Path.

Limits of a customer journey map

As useful as customer journey maps are, they are only one tool in the design, development or marketing process. It’s worth remembering that a customer journey map is not:

Specifications: A journey map is not a full set of product requirements that a developer can code against. For your map to eventually become a living breathing product, it will need to go through a range of additional documentation such as wireframes, systems architecture, site-maps and process flows. A code-ready process map will include several additional layers more than a normal journey map such as audience triggers, filters and rules along with key dependencies and systems integrations.

User stories: In an agile environment, a key artefact before something is built is the user-story, which is a fictional narrative that describe a user’s context, intention, actions and outcomes. User stories are often generated based on customer journey maps, but they are not the same thing because the user stories are more detailed and focused on a particular product feature or requirement.

Personas: Personas are an important input for a journey map, but the map itself doesn’t need to describe everything about the audience. A persona focuses on the person, whereas a journey map focuses on their experience.

Marketing Funnel: Journey mapping is a useful tool in creating a modern marketing funnel, but the journey map is not the funnel itself. A journey map tends to be a linear representation of a single journey, whereas a funnel is an aggregate view of all the different touchpoints. If a journey map tried to cover every single touchpoint, it would lose focus. A journey map usually assumes that someone makes it all the way through the journey, whereas a funnel makes specific allowances for people to drop out during the process.


The UK Government Communication Service’s journey map template.

Building your own journey maps

A hard truth about customer journey maps is that even though they look nice, the maps don’t generate an outcome by themselves. A journey map is a means to an end. The success of a journey map should be judged by what it enables people to create in terms of an improved customer experience.

Brands in New Zealand are catching up to the importance of building a connection between their top-of-the-funnel advertising and the rest of their digital and direct marketing. A customer journey map can help connects the dots between the various channels and elements of your marketing.

A real journey map is never finished. Especially if it’s for a digital product or marketing system, in which case the journey will be constantly improving. You may want to keep your original journey map as a record of where you’ve been, but I find that it’s even better to treat your journey map as a living document and update it as you learn and create new things.

The uncertainty principle in analytics

Everyone loves data. But there is a hidden problem lurking underneath the increasing reliance on analytics in the world of marketing and design. It seems like the more that we measure things, the less that we actually know and sometimes more measurement just  ends up making things worse.  This got me wondering about the tension between art and science.

Werner Heisenberg was one of the creators of quantum physics. In 1927 he published the “uncertainty principle” for which he is now best known. The principle states that: “It is impossible to determine accurately both the position and the velocity of a particle at the same instant.” Electrons are particularly pesky because to know where they are at any given time you have to stop them and measure their location. However, if you want to know how fast an electron is moving, then you have to let it run free and measure its speed instead. The uncertainty principle says that you can’t know both the speed and the location of an electron at the same time, and that you have to trade off between these two types of knowledge.

The uncertainty principle is a useful way of understanding the limits of human knowledge in any area where you need to balance the accuracy of a measurement and the effort put into taking the measurement. The principle applies to marketing and design because the more precisely you want to measure user behaviour, the more impact it will have on the user (which can then distort their behaviour). There are several types of hidden tradeoffs that people don’t realise about adding more analytics to their business.

1. Tradeoffs that impact behaviour

In email marketing, we use tracking links to tell whether someone has clicked a particular link in an email. The extreme versions of these links can identify a click down to an individual user, their device and even their geographic location. But to do this type of analysis you need to redirect the user through a link cloaking tool or a link shortener. The tradeoff is that spam filters hate these link cloaking tools because they can be used by scammers to send people to random destinations, instead of where ever  the user thought they were going. When you add link tracking to your emails you gain better analytics, but lose deliverability because some email servers may think that you could be a scammer.

The balanced compromise is to use UTM tracking codes added to the end of a normal web address. The added parameters can feed data to a tool like Google Analytics without hiding the true destination from the user. But even these links carry a tradeoff because they look ugly and can be confusing to some users, who are less likely to click on them. Again you have to trade measurement for performance.

Tradeoffs where increased measurement can decrease performance are the most common and most harmful instances of the uncertainty principle in marketing because modern marketing says that if a tree falls in the woods and there were no analytics to measure it, then did it really fall? But too much measurement can accidentally hurt your campaign.

2. Tradeoffs that impact performance

One of the most heated (and obscure) arguments that I have ever had in my professional life was about the placement of the Google Analytics tracking pixel on a website.

If you place the tracking code at the top of a page, then Google Analytics will load before the content and will do cool stuff like measuring page load times and tracking people even if they leave before the page has loaded. The tradeoff is that this can cause tiny delays that slow down the loading time of the web page. If you put the tracking code at the bottom of the page, then you gain speed, but you lose precision in your tracking.

The compromise is supposed to be to use a technique called “lazy loading” that allows the content and the tracking to load at the same time without competing with each other. But I’ve found time and again that this is a false promise and lazy loading makes the page even slower and also makes the tracking worse so no-one wins.

Over the years, the school of hard knocks has taught me to look for the “minimum viable tracking”. Which I define as the least disruptive tracking you can install that will allow your team to make meaningful decisions and let you improve the website design by more than the cost imposed by the addition of the tracking tools.

3. Tradeoffs that impact design

The last type of uncertainty principle is much more subtle. Sometimes adding more tracking can lead you down a path to making bad design decisions. The popular case studies for proving the value of analytics always seem to involve A/B testing the colour of a button and discovering that one colour of button outperformed another coloured button.

A/B testing is the process of showing two versions of a website to users and testing to see which version performs better. This is seductive because it reduces soft skills like design, copywriting and brand strategy down to the level of provable mathematics. But all this testing seems to lead to incremental improvements rather than true breakthroughs.

Optimising only a small part of an overall process can have surprising knock-on impacts. I’ve seen this in a user sign-up process where making the first step easier ended up hurting the last step so much that the overall process was less effective. Mathematicians call this seeking a “local optimum” instead of a “global optimum” (which would include the entire system). Local optimisation May feel good at the time, but it usually has a long-term tradeoff.

Unfortunately, to measure and optimise an entire system can require hardcore integration between various marketing metrics and CRM systems that are too much for a small team. So most startups are left optimising each step in isolation in the hope that the entire system falls into place eventually.

Finding the balance

I love the customer insights that good data analysis can bring, but these days I’m much more conscious of the tradeoffs that the uncertainty principle brings with it. Every insight comes with a hidden cost. So I treat every chance to observe user behaviour as a golden opportunity worth making the most of. Good user data is a terrible thing to waste.

Recently I’ve been finding that the best user data doesn’t come from tracking tools and analytics platforms, it comes from the company’s own databases.

Your own transaction records, user databases and CRM could be hiding a goldmine of user insights that don’t carry such a heavy analytics tradeoff. So instead of always looking to add more tracking, maybe try making better use of the data that you already have.